[Display Range (Trend Monitor)]
If what you want to see is not on the screen, scroll the graph up and down or zoom in/out.
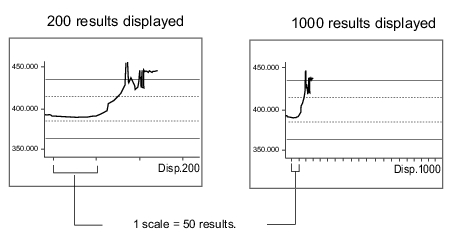
In addition, you can change the number of horizontally displayed results between 200 and 1000.
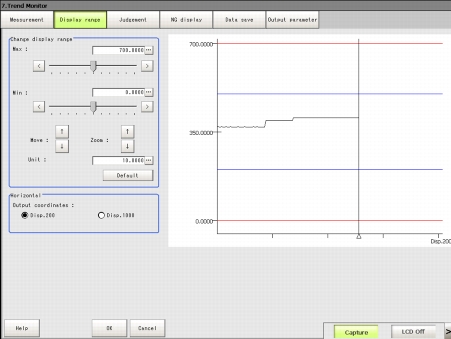
- In the "Item tab" area, tap [Display range].
A graph is displayed in the "Image display" area.
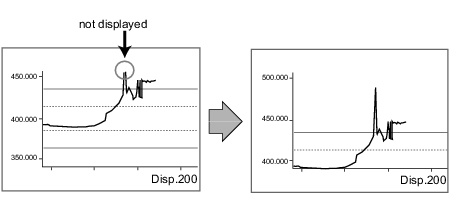
Specifying the top (Max) and the bottom (Min) of the graph to change the displayed range
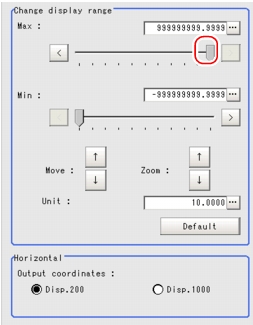
- In the "Change display range" area, drag the slider for "Max" to a preferred value.
The value can also be specified by tapping one of the buttons at both ends of the slider or tapping [...].
The specified maximum value becomes the top of the graph displayed in the "Image display" area.
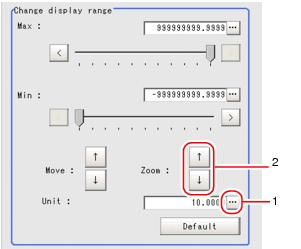
- In the "Change display range" area, tap an arrow of [Zoom:] to zoom in/out the graph.
Moving up and down the graph itself
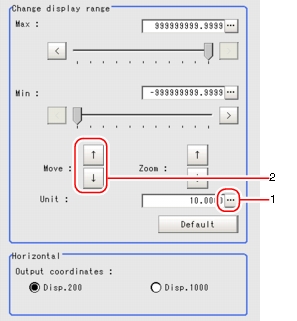
- In the "Change display range" area, tap [...] for "Unit" and specify how many units per tap when moving the graph.
- In the "Change display range" area, tap one of the arrow buttons of "Move" to move the graph.
In the "Image display" area, the graph will move accordingly.
The scale will also change as the graph moves.
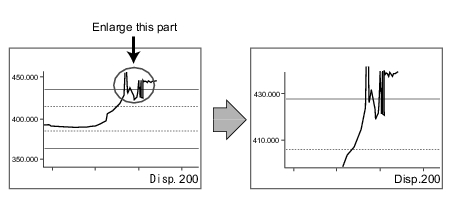
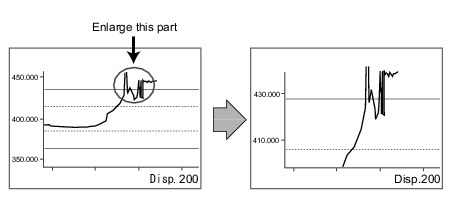
Example) Enlarging a part where measurement results were unstable:
- In the "Change display range" area, tap [...] for "Unit" and specify how many units per tap when enlarging the graph.
- In the "Change display range" area, tap one of the arrow buttons "Zoom" to enlarge the graph.
In the "Image display" area, the graph is displayed in an enlarged view.
The scale will also change as the graph moves.
Setting the optimum range automatically
- In the "Change display range" area, tap [Default].
The optimum range including the maximum and minimum values of the input data is displayed.
If two or more data inputs are not available, a message that prompts for input will appear. Tap [Default] after performing measurement twice or more.
Changing the horizontal display range (the number of displayed results)
- In the "Horizontal" area, select the number of results displayed in the horizontal direction.
The graph is displayed with the specified number of results.
 User's Manual, "Inputting a Value"
 Setting up [Trend Monitor].
