Verification Charts
The Value and occurrence time of NG can be visualized from measurement results logged by trend monitor. Up to 35 Last NG results can be visualized. This is Helpful for analyzing the occurrence time and reasons of NG.
 Note
Note- For the trend monitor to save only measurement images that judged to be NG, set up all processing units except [Trend Monitor] so that their results should be OK.
- In the [Flow] of the "Control" area of the Main screen, tap the icon of [Trend Monitor].
The ProcItem Setting window is displayed.
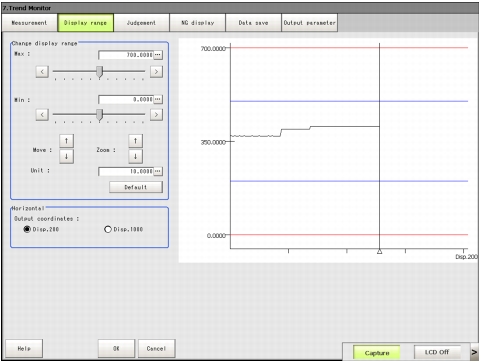
- Tap [Display range] of the "Item tab" area in the ProcItem Setting window.
Figures are shown in the "Image display" area.
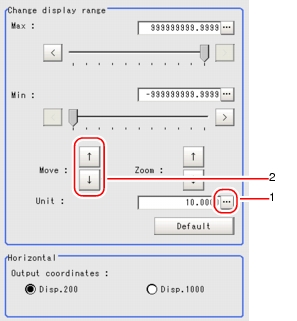
Specifying the top (Max) and the bottom (Min) of the graph to change the displayed range
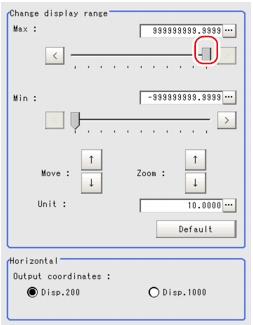
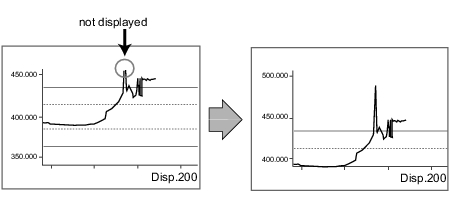
- In the "Change display range" area, drag the slider for [Max] to a preferred value.
The value can also be specified by tapping one of the buttons at both ends of the slider or tapping [...].
The max value that you set up will be located above the figure.
- Specify the "Min." value in the same way as the "Max." value.
Moving up and down the graph itself
- In the "Change display range" area, tap [...] for [Unit] and specify how many units per tap when moving the graph.
- In the "Change display range" area, tap one of the arrow buttons of "Move" to move the graph.
The diagrams in the "Image display" area will be moved.
The scale will also change as the graph moves.
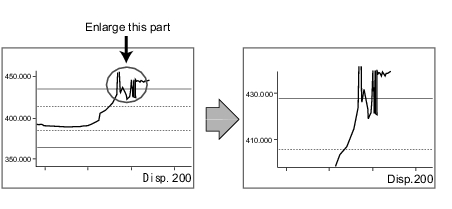
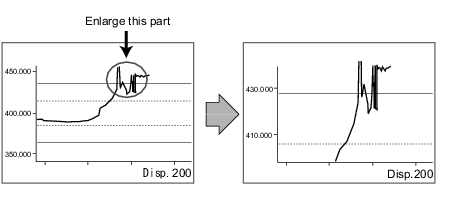
Example) Enlarging a part where measurement results were unstable:
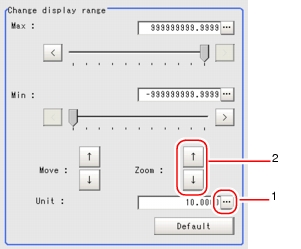
- In the "Change display range" area, tap [...] for "Unit" and specify how many units per tap when enlarging the graph.
- In the "Change display range" area, tap an arrow of "Zoom:" to zoom in/out the graph.
The figure in the "Image display" area will be Zooming.
The scale will change with the moving of figure.
Setting the optimum range automatically
- In the "Change display range" area, tap [Default].
The optimum range including the maximum and minimum values of the input data is displayed.
If two or more data inputs are not available, a message that prompts for input will appear. Tap [Default] after performing measurement twice or more.
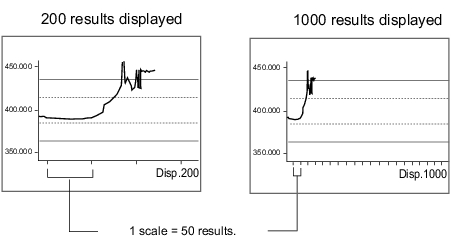
When changing horizontal view (number of pieces)
- In the "Horizontal" area, select the number of results displayed in the horizontal direction.
View figure according to the set number of pieces.
Verifying NG view
- In the [Flow] of the "Control" area of the Main screen, tap the icon of [Trend Monitor].
The ProcItem Setting window is displayed.
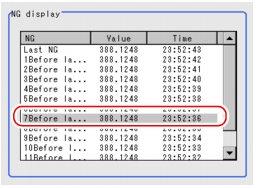
- In the ProcItem Setting window, tap [NG display] in the "Item tab" area.
- In the "NG display" area, tap an NG result to be displayed.
The measurement values and time are displayed.
In the "Image display" area, longitudinal line at NG position overlapped with figure shows where NG occurs.
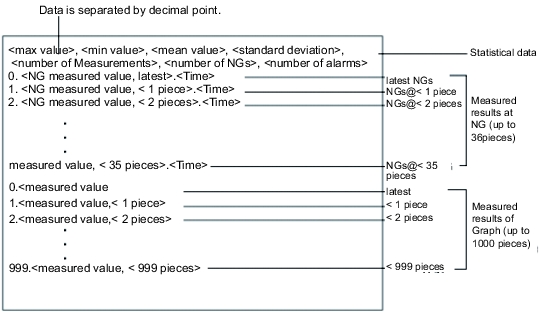
Measured Data (CSV Format)
 Inputting a Value.
