Calculate the variations of the measurement result
Overview
This example calculates the variations of the measurement result and displays them.
Specification of this example
Behavior
Get the measurement result (X, Y) from [ECM Search], and store the data.
Calculate the average, variance and standard deviation from stored measurement values.
Draw calculated values as text in Image Window.
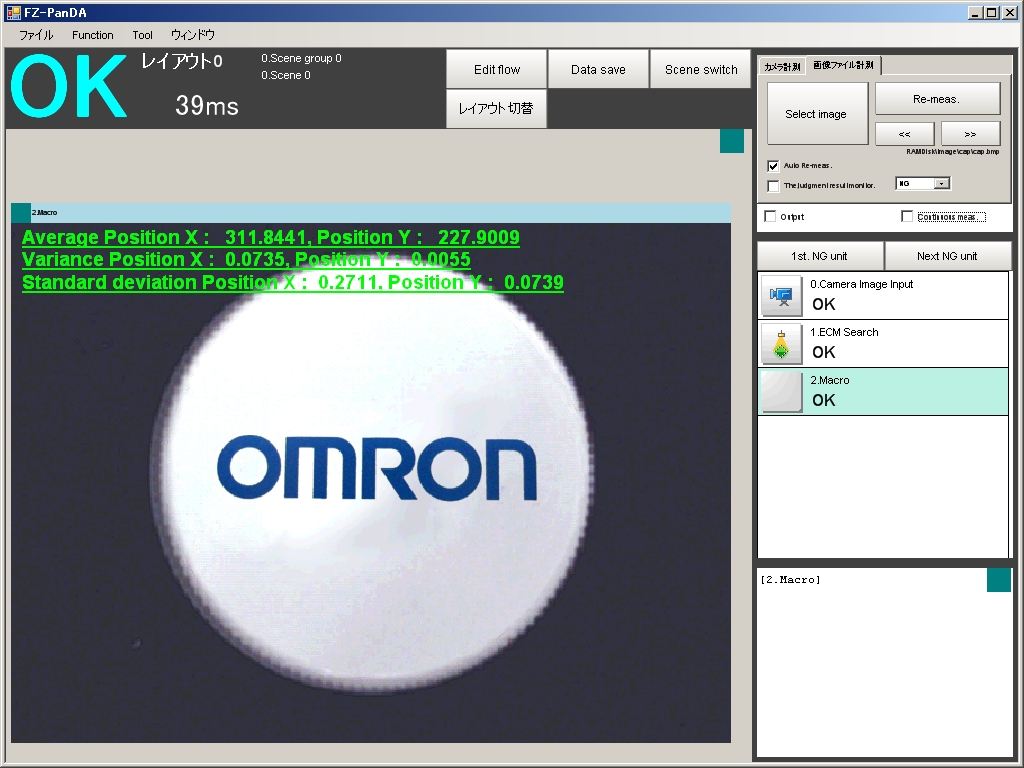
Screenshot
 How to try this example
1.Click the link below, then the folder containing zip file automatically opens.
 File
File
2.Right-click and hold on the zip file, and drop it on working window of FJ system. The images and scene data in zip file are loaded on the program automatically.
3.Re-measure the image. Then System automatically calculates the variations of the measurement result (average, variance, standard deviation) and displays them in Image Window.
How to implement
Scene data
Unit No.
|
Processing Item
|
0.
|
Camera Image Input
|
1.
|
ECM Search
|
2.
|
Macro
|
The Macro Program below segment is to be set in '2.Macro'.
Macro Program
*MCRINIT
    'Initialize                               '(1)
    ECMSEARCHUNITNO& = 1
    AVERAGEXCNT# = 0
    AVERAGEYCNT# = 0
    COUNT& = 0
    MAXCOUNT& = 1000
    FONTSIZE& = 20

    Dim POSITIONX#(MAXCOUNT& - 1), POSITIONY#(MAXCOUNT& - 1)

Return

*MEASUREPROC

    GetUnitData ECMSEARCHUNITNO&, "X", POSITIONX#(COUNT&)     '(2)
    GetUnitData ECMSEARCHUNITNO&, "Y", POSITIONY#(COUNT&)

    AVERAGEXCNT# = AVERAGEXCNT# + POSITIONX#(COUNT&)         '(3)
    AVERAGEYCNT# = AVERAGEYCNT# + POSITIONY#(COUNT&)

    AVERAGEX# = AVERAGEXCNT# / (COUNT& + 1)
    AVERAGEY# = AVERAGEYCNT# / (COUNT& + 1)

    For CNT& = 0 To COUNT& Step 1         '(4)
        VARIANCEX# = VARIANCEX# + ((POSITIONX#(CNT&) - AVERAGEX#) * (POSITIONX#(CNT&) - AVERAGEX#))
        VARIANCEY# = VARIANCEY# + ((POSITIONY#(CNT&) - AVERAGEY#) * (POSITIONY#(CNT&) - AVERAGEY#))
    Next
    VARIANCEX# = VARIANCEX# / (COUNT& + 1)
    VARIANCEY# = VARIANCEY# / (COUNT& + 1)

    SDEVX# = Sqr(Abs(VARIANCEX#))         '(5)
    SDEVY# = Sqr(Abs(VARIANCEY#))

    COUNT& = COUNT& + 1

Return

*MEASUREDISPG
    SetTextStyle FONTSIZE&, TA_TOP, JUDGE_OK, 0, FONTSTYLE_BOLD + FONTSTYLE_UNDERLINE

    DrawTextG "Average Position X : " + Str2$(AVERAGEX#, 5, 4, 0, 0) + ", Position Y : " + Str2$(AVERAGEY#, 5, 4, 0, 0), 10, 20, 0    '(6)
    DrawTextG "Variance Position X : " + Str2$(VARIANCEX#, 2, 4, 0, 0) + ", Position Y : " + Str2$(VARIANCEY#, 2, 4, 0, 0), 10, 40, 0
    DrawTextG "Standard deviation Position X : " + Str2$(SDEVX#, 2, 4, 0, 0) + ", Position Y : " + Str2$(SDEVY#, 2, 4, 0, 0), 10, 60, 0

    '(7)
    If COUNT& >= MAXCOUNT& Then
        DrawTextG "The maximum of measurement times has come. Stop measurement and reload this scene, please.", 10, 100, 0
    EndIf

Return
The macro program is in
this link.
Explanation
(1)Initialize parameters(ex.the maximum of measurement times ) when initialize measurement.
(2)Get the measurement result (position X and position Y) of [ECM Search].
(3)Caluculate the averages of the measurement results.
(4)Caluculate the variances of the measurement results.
(5)Caluculate the standard deviations of the measurement results.
(6)Display the caluculated indicators of variations in Image Window.
(7)Display the warning message to stop measurement when measurement times is the maximum.